Monitor websites in real-time, track defects accurately and fix problems quickly
FrontJS monitors your website in real-time, reports development defects before your customers do, helps to fix problems quickly, maintains website quality, guides and improves your customers’ experience.
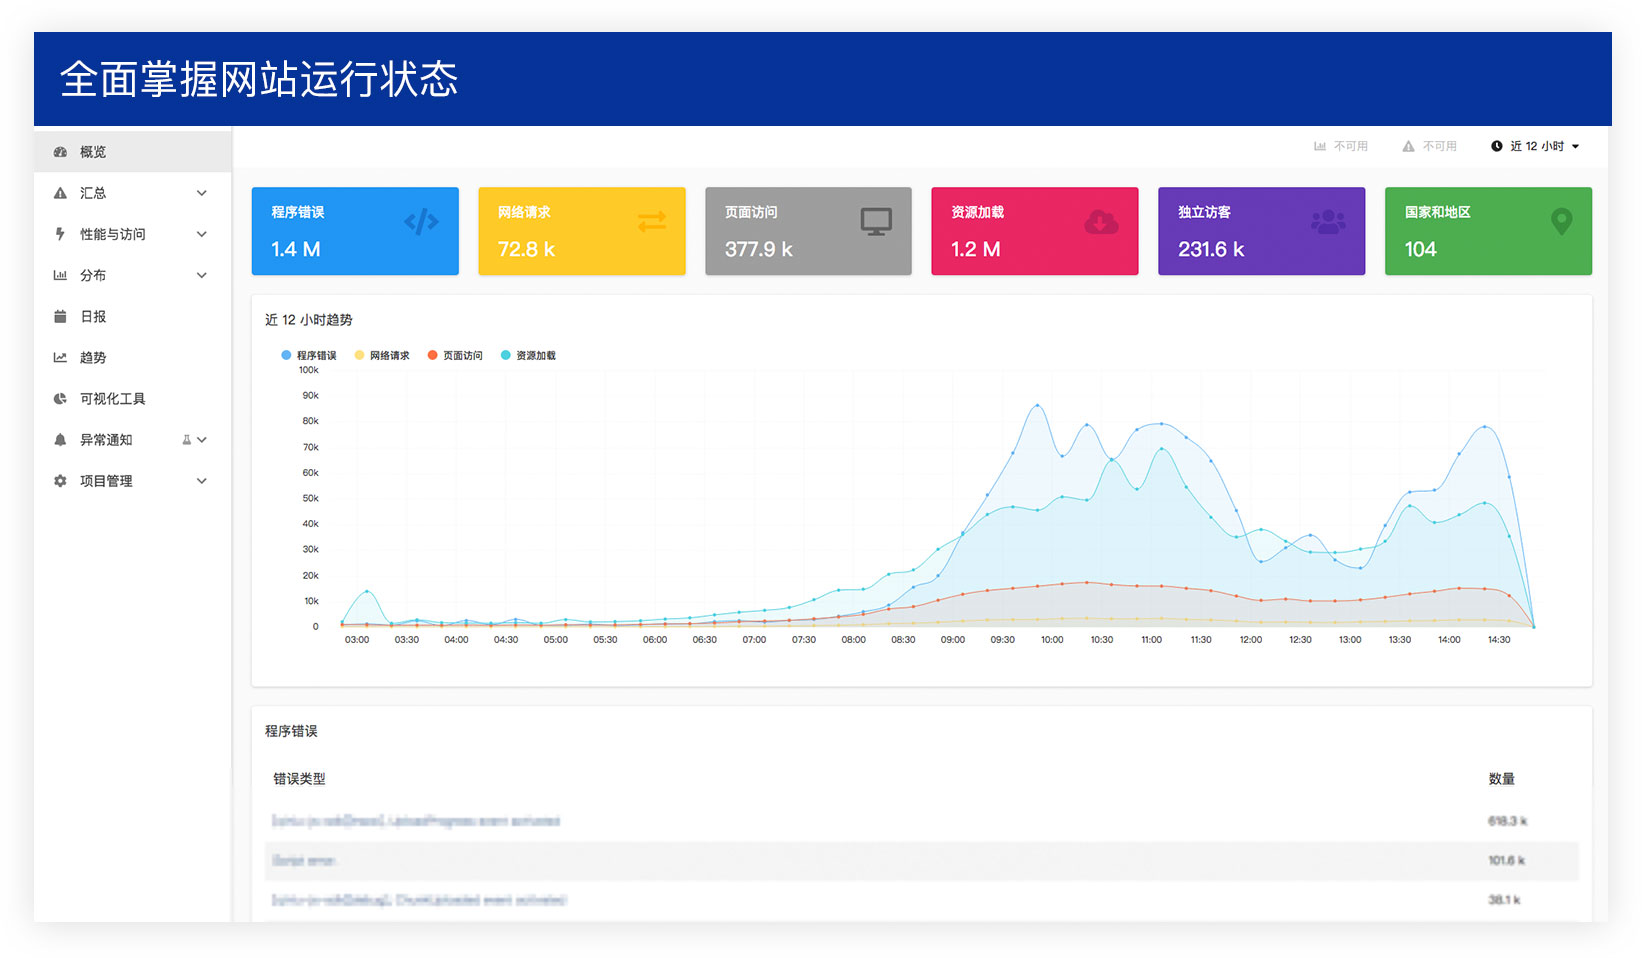
The running status of the website is clear
Project Overview
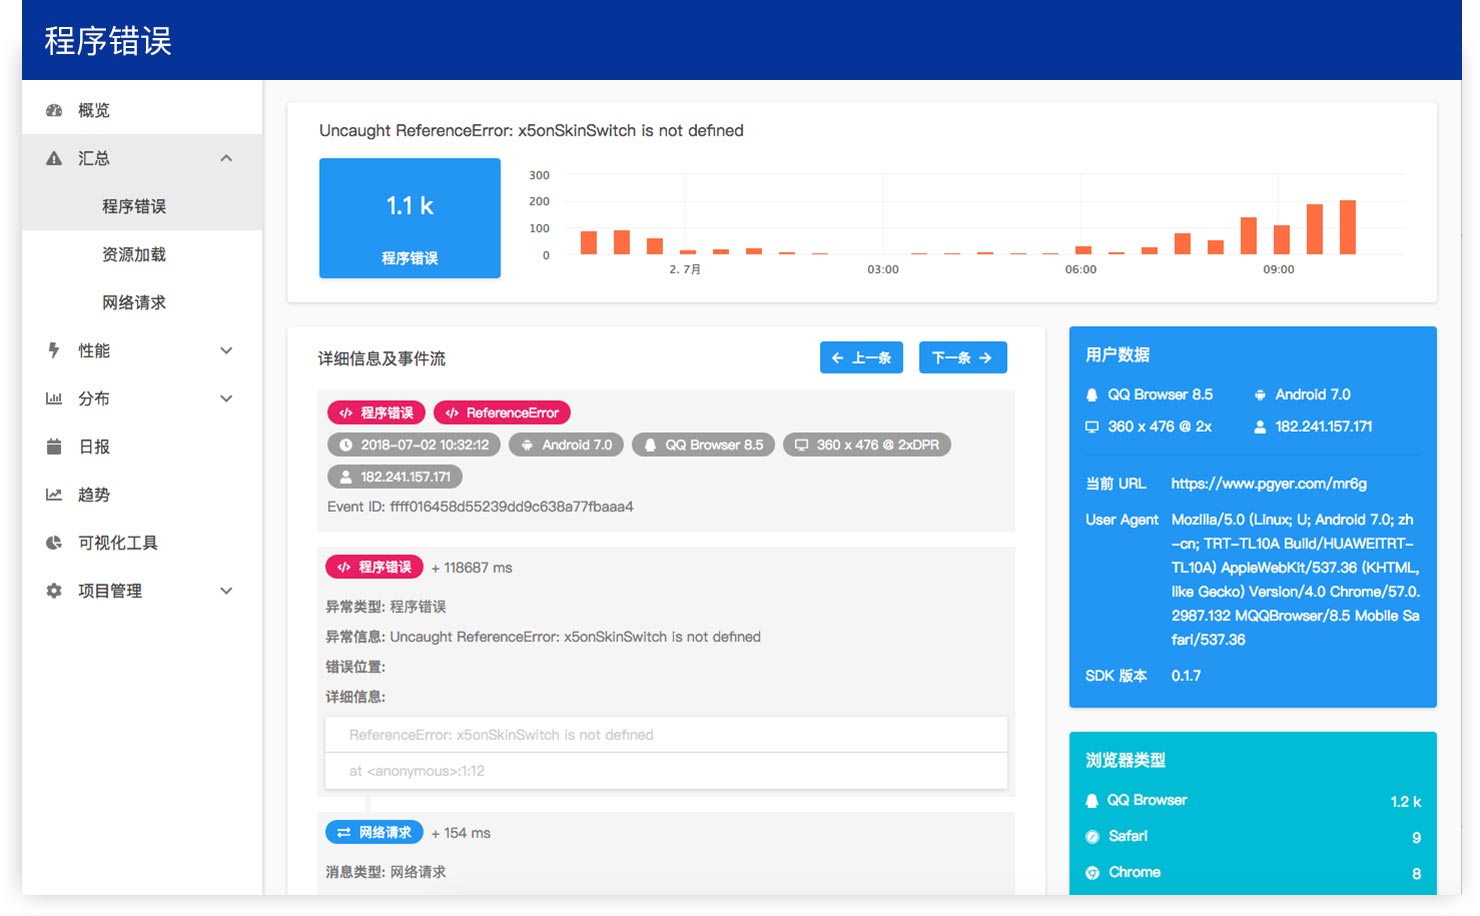
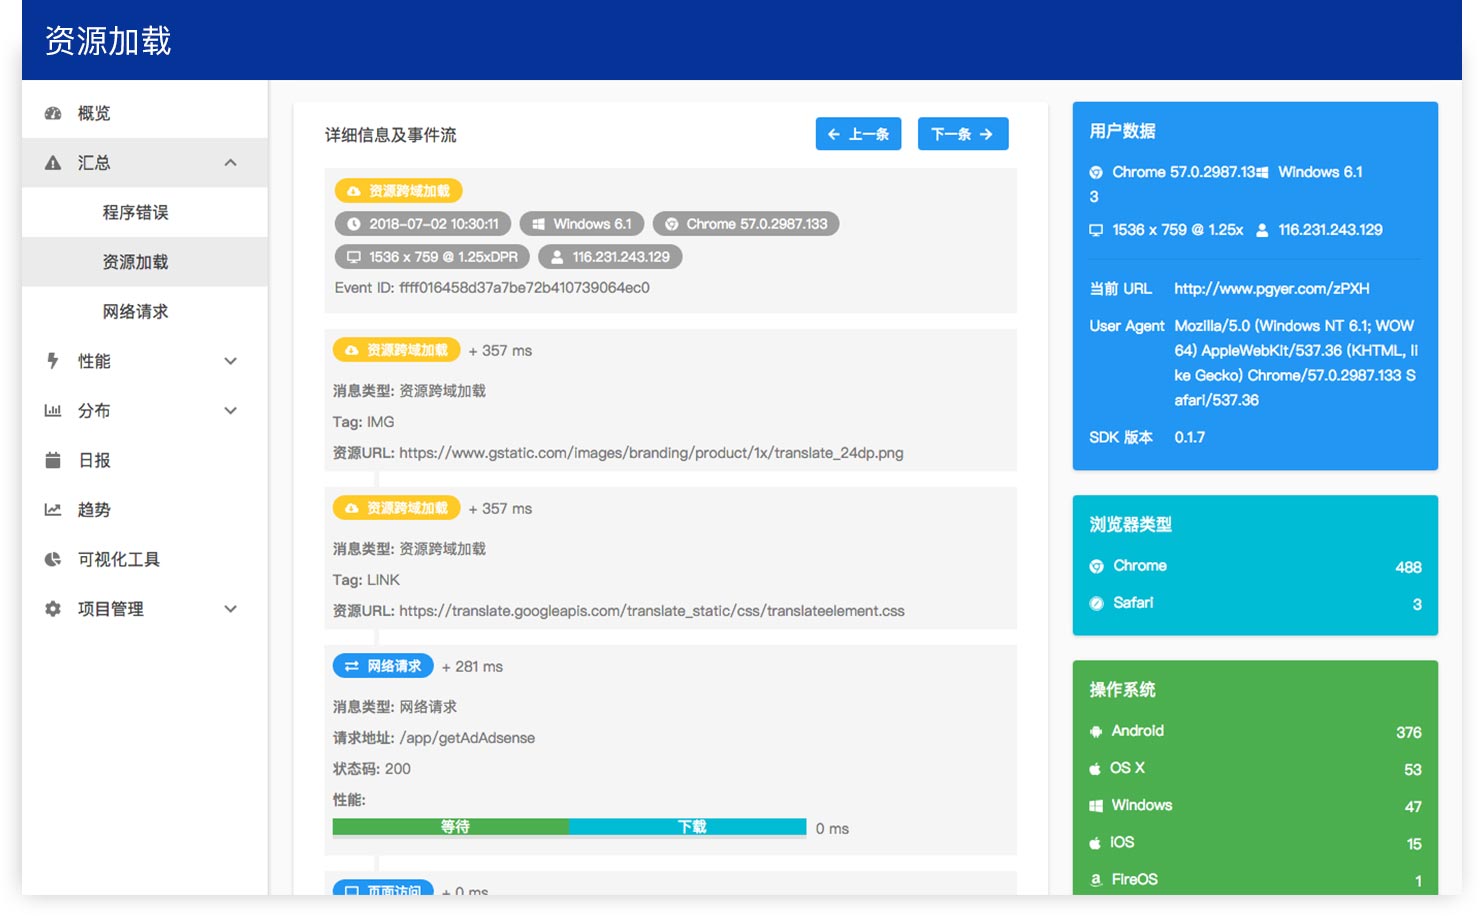
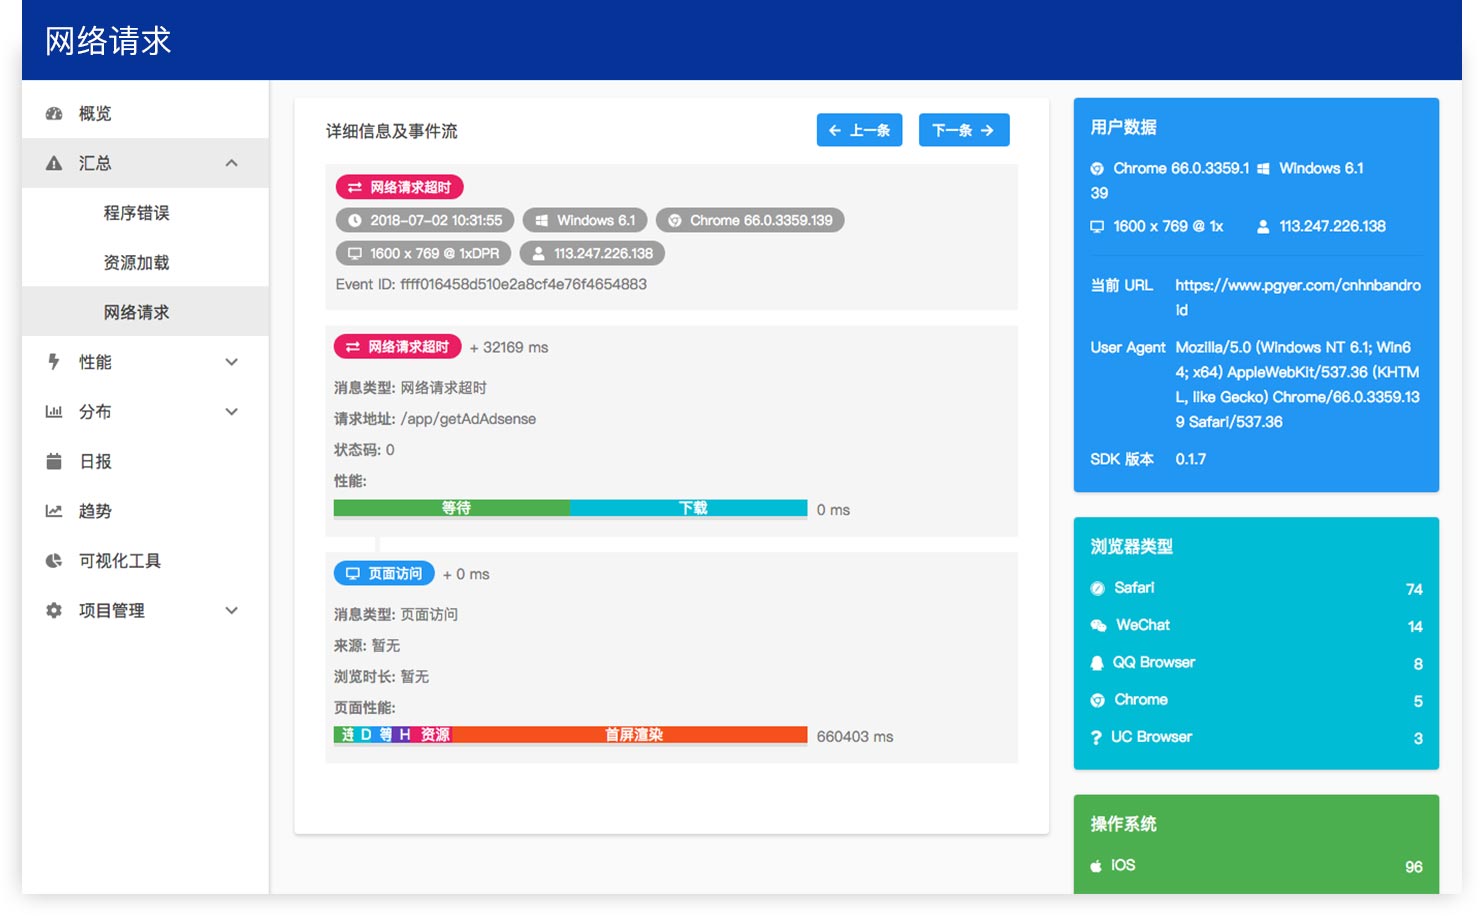
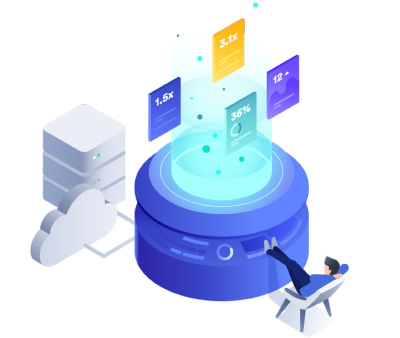
FrontJS provides current monitoring of website health and data indications of independent visitors and national areas,shows time-lapse peaks and changes in website program errors, resource loading, network requests and website performance information, helps to quickly master the environment in which problems occur, knows the way how do website defects affect your customers, and guides the website improvement plan.
Detailed website’s abnormal information summary
  • Program Error
  • Resource Loading
  • Network Request

Program error information monitoring

Monitoring Level: Info Warning Error
Time Range: Nearly 1 hour to nearly 15 days
Time Content:
  • Wrong Content
  • Call Stack    
  • Quality    
  • Time    
  • User Quantity
  • Recent Trend
  • User Data    
  • Operating System
  • Browser    
  • IP Address    
  • Page Address
  • Event Flow    

Resource loading information monitoring

Monitoring Level: Cross-Domain Load Load Failure
Time Range: Nearly 1 hour to nearly 15 days
Time Content:
  • Resource Name
  • Quality    
  • Time    
  • User Quantity
  • Recent Trend
  • User Data    
  • Operating System
  • Browser    
  • IP Address    
  • Page Address
  • Event Flow    

Network request information monitoring

Monitoring Level: Normal Request Cross-Domain Request                                       Request Failure
Time Range: Nearly 1 hour to nearly 15 days
Time Content:
  • Endpoint    
  • Status Code
  • Perfermance    
  • Quality    
  • Time    
  • User Quantity
  • Recent Trend
  • User Data    
  • Operating System
  • Browser    
  • IP Address    
  • Page Address
  • Event Flow
Complete website performance monitoring report
Provide network request and page loading information to bring you accurate page performance reports, to guide and improve the customers’ experience

Network Request

Obtain page network request and response time data, provide HTTP status code distribution, distribution map of downloading time and page address,browser type,operating system,IP address and other related network request information.

Experience Demo

Resource Loading

Obtain page resource loading and response time data, provide distribution map of resource downloading time, page address, browser type, operating system, IP address and other related resource loading information.

Experience Demo

Page Access

Obtain multiple loading performance,browsing time and access data of the page, support jump in single-page application, provide visiting information on the page about the distribution map of resource downloading time, the sanki of the main source and flow of the page.
Experience Demo
Classify Information in a highly visible way
Classify error messages with maximum efficiency and visibility to help developers build high-quality sites more efficiently and iterate quickly.

By Page

Program errors, resource loading, network requests and access page are queried by page ,and other environmental information are provided.

By Browser

Program errors, resource loading, network requests, access page are queried by browser ,and other environmental information are provided.

By Operating System

Program errors, resource loading, network requests, access page are queried by operating system, and other environmental information are provided.

By IP Address

Program errors, resource loading, network requests, access page are queried by IP address, and other environmental information are provided.
Daily Summary
Provide information report of website monitoring and geographical distribution map of visitors in nearly 15 days, make it easy to maintain the quality of website timely and quantitatively, to work efficiently. Experience Demo
Trend Comparison
Provide daily activitve visitor and page access trend graphs of the website, summarize the year-on-year increase and decrease trend report of the Top 10 monitoring data. Experience Demo
Visualization Tool
Support visual template customization, provide practical templates to obtain visual information as you wish. Experience Demo
Stack Track
Stack track is no longer a mystery, we make it possible to obtain abnormal information accurately about the context, and easy to locate the error. Experience Demo
Source Map
It supports full symbolic tracking features to help you locate the exact line of code error. Experience Demo
Master all the abnormal in front-end
Never miss any bug, receive sudden abnormal alarm of the website in anytime, ensure the website runs efficiently in the first time.
Get the website’s abnormal alarm within three minutes
Quick access, make it enjoyable to experience
Copy and paste to deploy quickly
Sign up for FrontJS and create a project
Fill in the project information and complete the project creation
Copy and paste the monitoring code to the target project
Start monitoring abnormal and performance information of website in real-time
FrontJS supports multiple browsers perfectly, just want to give you a better service
Chrome
Firefox
Safari
Opera
IE
Android
iOS
Efficient is close at hand
Track website failures rapidly, fix problems in time, maintain website quality, guide and improve the users' experience